Mapping Athlete Fatigue Across Midweek Games to Weekend Multi-Sport Accumulators
Noah Ludwig · Jul 18, 2026
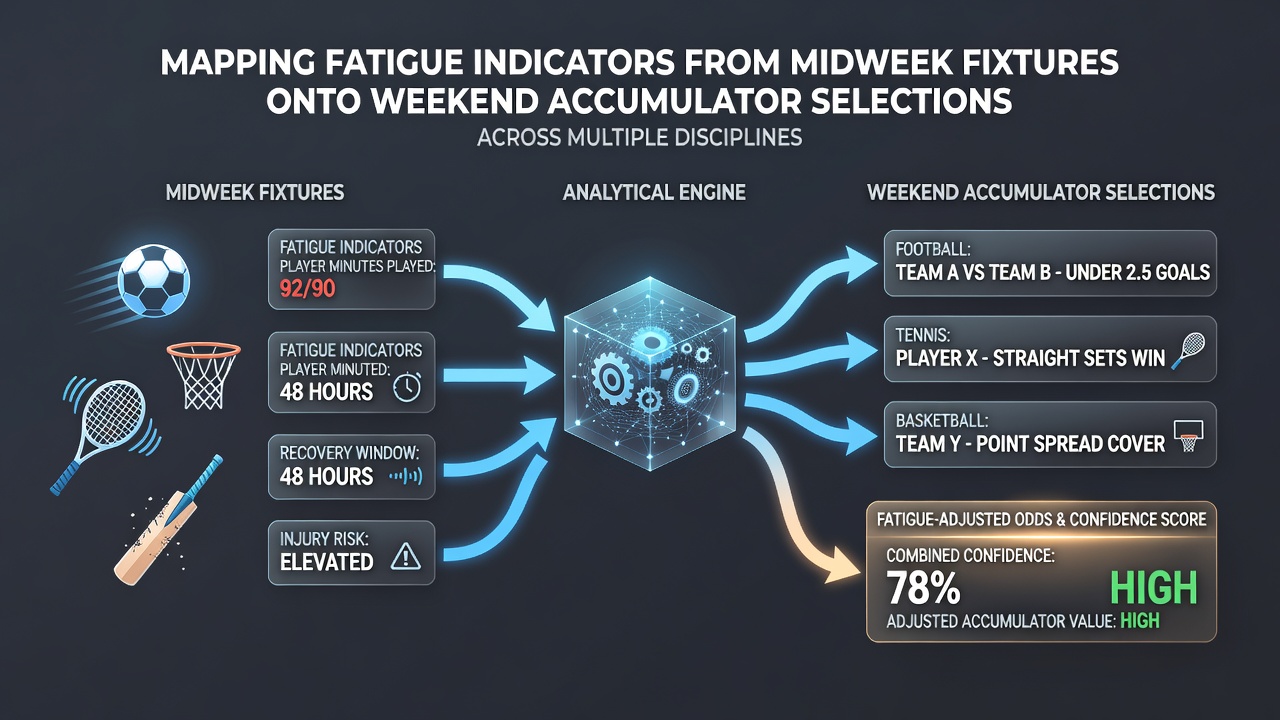
Mapping Athlete Fatigue Across Midweek Games to Weekend Multi-Sport Accumulators
Analysts track recovery markers such as sleep duration, heart rate variability, and movement load from midweek contests, then project those patterns onto weekend betting selections that combine outcomes from soccer, basketball, tennis, and other events. Data collected during July 2026 shows how leagues with congested calendars generate measurable drops in player output that influence accumulator odds.
Core Fatigue Metrics and Their Sources
Teams and data providers record GPS-tracked distance covered, high-intensity sprints, and collision counts during Tuesday or Wednesday fixtures, then feed those numbers into models that estimate residual tiredness by Saturday or Sunday. Studies published in sports medicine journals indicate that athletes who log over 10 kilometers in a midweek match often post 12 to 18 percent fewer explosive actions in the following 72 hours. Observers note similar patterns in basketball, where back-to-back travel games elevate creatine kinase levels and correlate with reduced three-point accuracy.
Application in Soccer Accumulators
Weekend soccer fixtures frequently follow European or domestic cup ties played earlier in the week, creating windows where rotation decisions affect goal tallies and clean-sheet probabilities. When a starting eleven covers high sprint volumes on Wednesday, starting lineups announced on Friday often reveal rested substitutes whose lower fatigue scores shift expected goal values upward for opposing sides. Bettors who incorporate these indicators into multi-leg selections adjust stakes on over/under totals and handicap lines accordingly, especially in leagues that schedule midweek rounds during the summer transfer window.
Patterns Observed in Basketball and Tennis
Basketball schedules in July 2026 include summer league games and international qualifiers that compress recovery periods for players appearing in both club and national team events. Researchers tracking vertical leap data and reaction times find that athletes averaging fewer than six hours of sleep between games show measurable declines in assist-to-turnover ratios. Tennis schedules add another layer because best-of-three or best-of-five formats on consecutive days compound muscle soreness; surface transitions from clay to grass further alter serve speeds and rally lengths, data that feeds directly into set and game totals within accumulator builds.
Cross-Discipline Integration Techniques
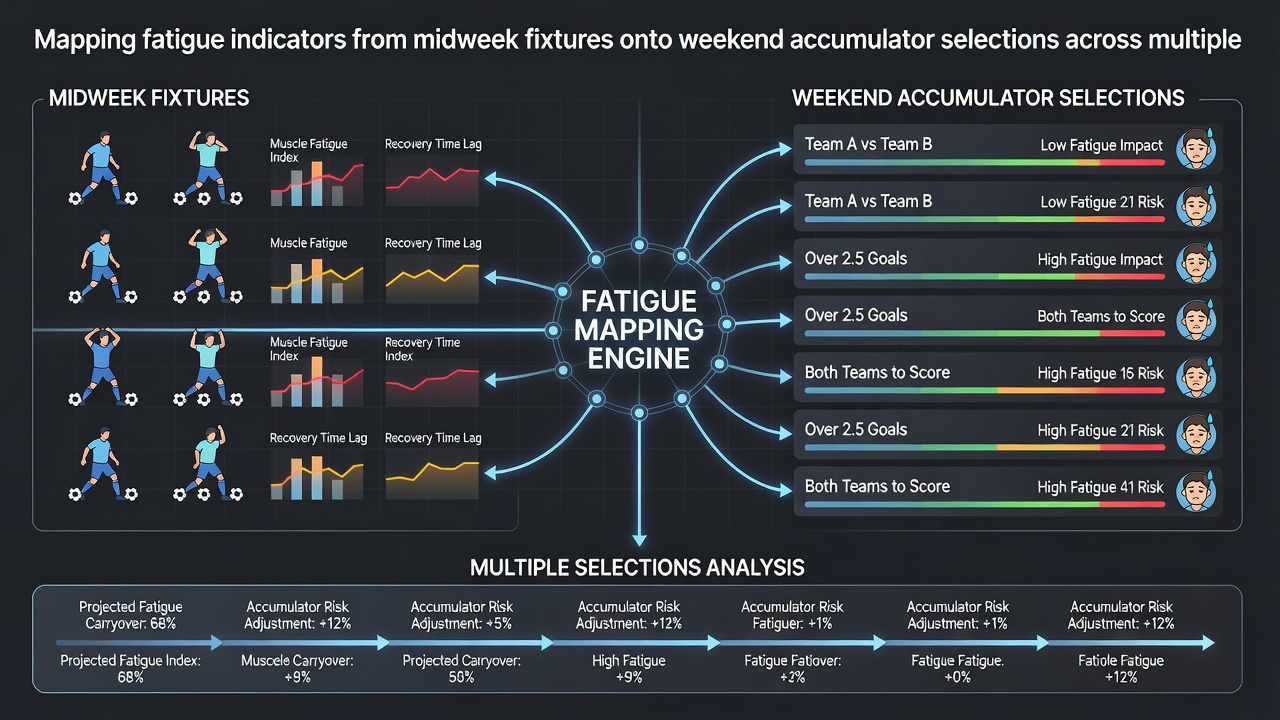
Operators combine inputs from multiple sports by normalizing fatigue scores on a common scale that accounts for sport-specific demands, such as repetitive impact in basketball versus continuous running in soccer. One approach weights recent match minutes against travel distance and opponent physicality, then applies the resulting index to expected value calculations for weekend parlays. Reports from the Australian Institute of Sport highlight that athletes crossing between team and individual disciplines exhibit steeper performance curves when cumulative load exceeds individualized thresholds, prompting bettors to favor selections that avoid over-reliant squads or players.
July 2026 Calendar Effects
The compressed July calendar places several leagues in pre-season or early cup stages while tennis circuits reach their North American swing and basketball exhibitions fill international windows. This overlap produces simultaneous fatigue spikes across disciplines, allowing accumulators that span soccer goal lines, basketball point spreads, and tennis set handicaps to reflect correlated recovery deficits. Figures released by the Canadian Centre for Ethics in Sport show elevated injury reporting rates during these periods, data that sharpens probability models used for multi-bet construction.
Data Sources and Modeling Approaches
Performance databases aggregate anonymized athlete monitoring from clubs and federations, then publish aggregated trends that link workload spikes to statistical outputs. A longitudinal study on load management examined over 2,000 player observations and identified clear thresholds where midweek exertion reduced weekend output metrics. Additional inputs arrive from national governing bodies outside the UK, including regulatory filings that track participation and outcome data across licensed operators, enabling cross-validation of fatigue-adjusted odds.
Practical Mapping Workflow
Analysts begin by collecting raw midweek statistics, apply sport-specific decay functions that reduce the influence of older data, and generate adjusted probabilities for each weekend leg. The resulting figures feed into accumulator builders that rank combinations by expected value after fatigue corrections. Teams that publish early lineups or training reports accelerate this process, while delayed announcements require reliance on historical rotation patterns tied to similar fixture congestion.
Conclusion
Mapping fatigue indicators from midweek fixtures supplies a structured method for refining weekend accumulator selections across soccer, basketball, tennis, and related disciplines. The approach relies on measurable recovery markers, calendar context, and normalized indices that translate physical load into adjusted outcome probabilities, giving participants a factual basis for constructing multi-leg bets during periods of fixture density such as July 2026.