From Baseline Rallies to Three-Point Barrages: Data-Driven Approaches to Tennis and Basketball Betting Markets
Nils Fischer · Aug 18, 2026

From Baseline Rallies to Three-Point Barrages: Data-Driven Approaches to Tennis and Basketball Betting Markets
Analysts track rally lengths in tennis alongside three-point attempt rates in basketball because these metrics shape betting lines on match totals, set durations, and quarter scoring margins. Data from professional circuits shows that extended baseline exchanges in tennis often extend game times beyond averages, which influences over/under markets on sets and matches while three-point barrages in basketball shift point spreads and totals during high-volume shooting periods.
Tennis Rally Patterns and Market Adjustments
Baseline rallies of eight shots or more occur more frequently on clay surfaces where players construct points through consistent depth and spin; records from the Association of Tennis Professionals indicate these prolonged exchanges add an average of twelve seconds per point compared with shorter net-rush sequences. Bettors who monitor rally-length distributions adjust totals bets accordingly because matches featuring multiple long rallies tend to push set lengths past standard projections. Surface-specific models incorporate historical rally data from tournaments such as the French Open and Wimbledon, where clay courts produce higher rally counts and grass courts favor quicker points that compress overall durations.
Player-specific tendencies further refine these calculations; those who rely on heavy topspin from the baseline generate longer rallies against similar opponents, and analysts compile shot-by-shot logs to forecast how these patterns alter expected game counts. In August 2026, several hard-court events scheduled across North America and Asia present data sets where rally statistics from prior hard-court swings help refine pre-match totals lines for both singles and doubles formats.
Basketball Three-Point Volume and Scoring Projections
Three-point attempt rates have risen steadily across professional leagues because teams adopt spacing systems that increase corner and wing opportunities; league-wide data from the National Basketball Association reveals that squads averaging thirty-five or more three-point attempts per game post higher variance in quarter scoring totals. This variance creates edges in live betting markets where totals and spreads move quickly after early three-point barrages alter expected point outputs. Defensive schemes that permit open threes also appear in box-score tracking, and models weight opponent three-point defense percentages when projecting second-half totals.
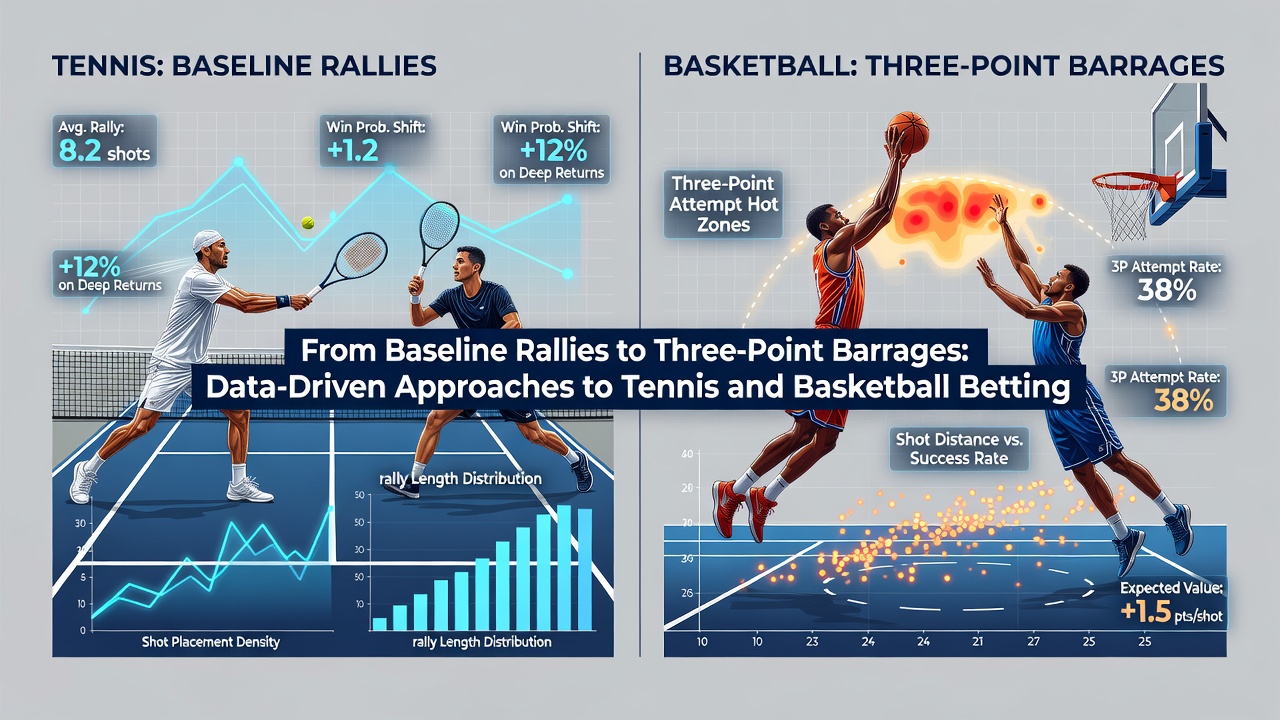
Player tracking systems record release angles and defender distances, which feed algorithms that predict three-point success probabilities under different defensive alignments; these inputs adjust in-game betting thresholds for over/under points during stretches when teams shift to perimeter-heavy offenses. International competitions scheduled for summer 2026 incorporate similar data streams from FIBA events where three-point volume correlates with overtime frequency and margin outcomes.
Integrating Cross-Sport Data Models
Operators combine rally metrics from tennis with three-point frequency data from basketball because both sports reward quantitative approaches to duration and scoring variance; multi-sport bettors apply regression models that weigh surface effects in tennis against pace factors in basketball when constructing accumulator selections. Historical data sets reveal that tennis matches exceeding average rally counts often align with basketball games featuring elevated three-point volume in terms of total points or games played, yet independent variables such as weather delays or travel schedules require separate adjustments.
Academic researchers at institutions including the University of Sydney have examined how granular performance logs improve forecast accuracy across racket and court sports, and industry reports from the Australian Gambling Research Centre highlight the growing use of these models in regulated markets outside the United Kingdom. Observers note that real-time feeds from optical tracking systems allow continuous recalibration of odds as rally lengths or three-point attempts deviate from pre-match baselines.
Practical Applications in Current Markets
Betting platforms update lines after each completed set or quarter because accumulated data on rally counts and three-point makes shifts implied probabilities; traders incorporate these updates into automated systems that flag discrepancies between live odds and statistical projections. In August 2026, upcoming tennis Masters events and basketball preseason schedules supply fresh data points that refine existing algorithms for both pre-match and in-play wagers. Those who follow player workload reports also factor fatigue indicators into models, since extended baseline rallies in tennis and high three-point loads in basketball both correlate with later-set or fourth-quarter performance drops.
Conclusion
Data-driven methods continue to shape betting markets in tennis and basketball by converting rally statistics and three-point metrics into actionable projections for totals, spreads, and accumulators. Ongoing collection of surface-specific and opponent-adjusted figures supports more precise line movements throughout the 2026 calendar, and cross-sport comparisons offer additional context for bettors who track variance across different athletic disciplines.