Fixture Overloads and Observable Performance Shifts in Soccer, Tennis, and Basketball Competitions
Jordan Fischer · May 23, 2026
Fixture Overloads and Observable Performance Shifts in Soccer, Tennis, and Basketball Competitions
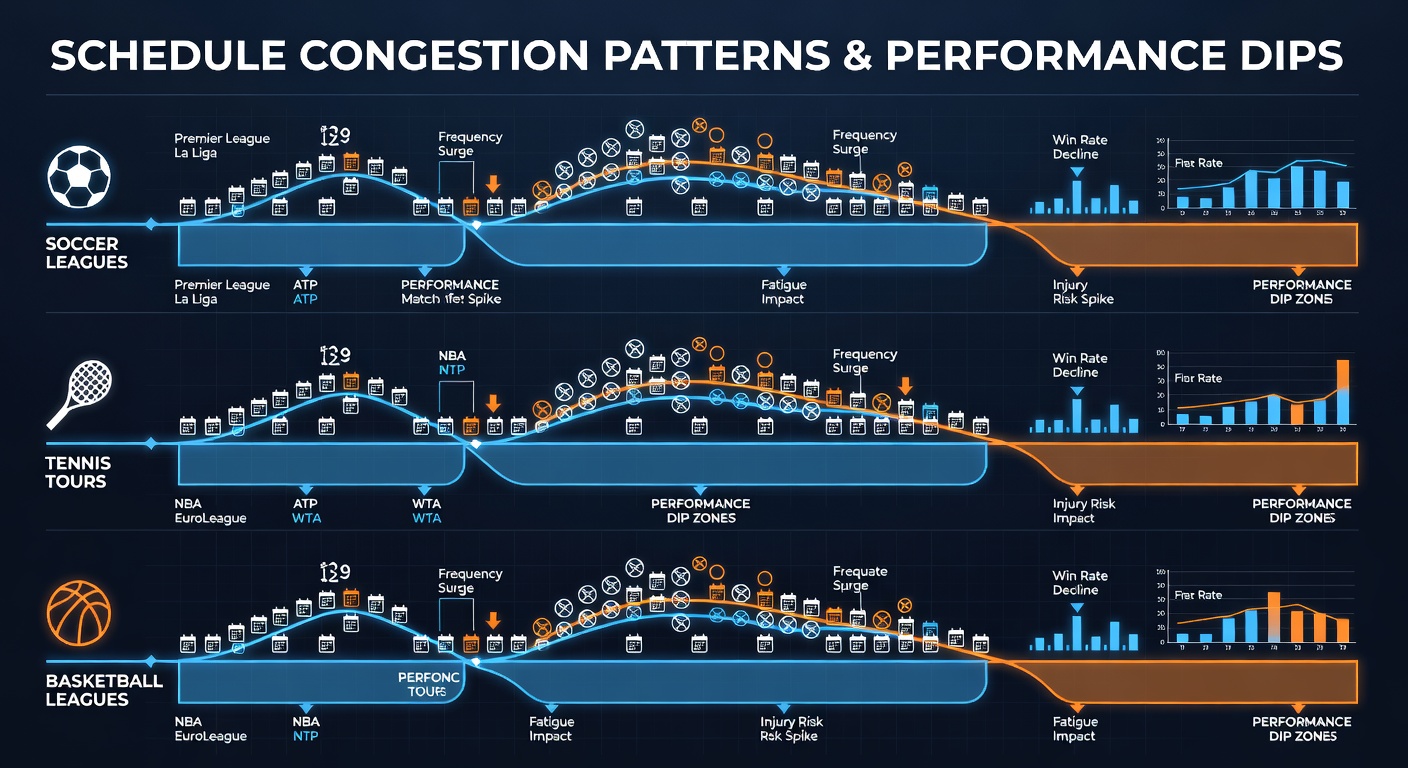
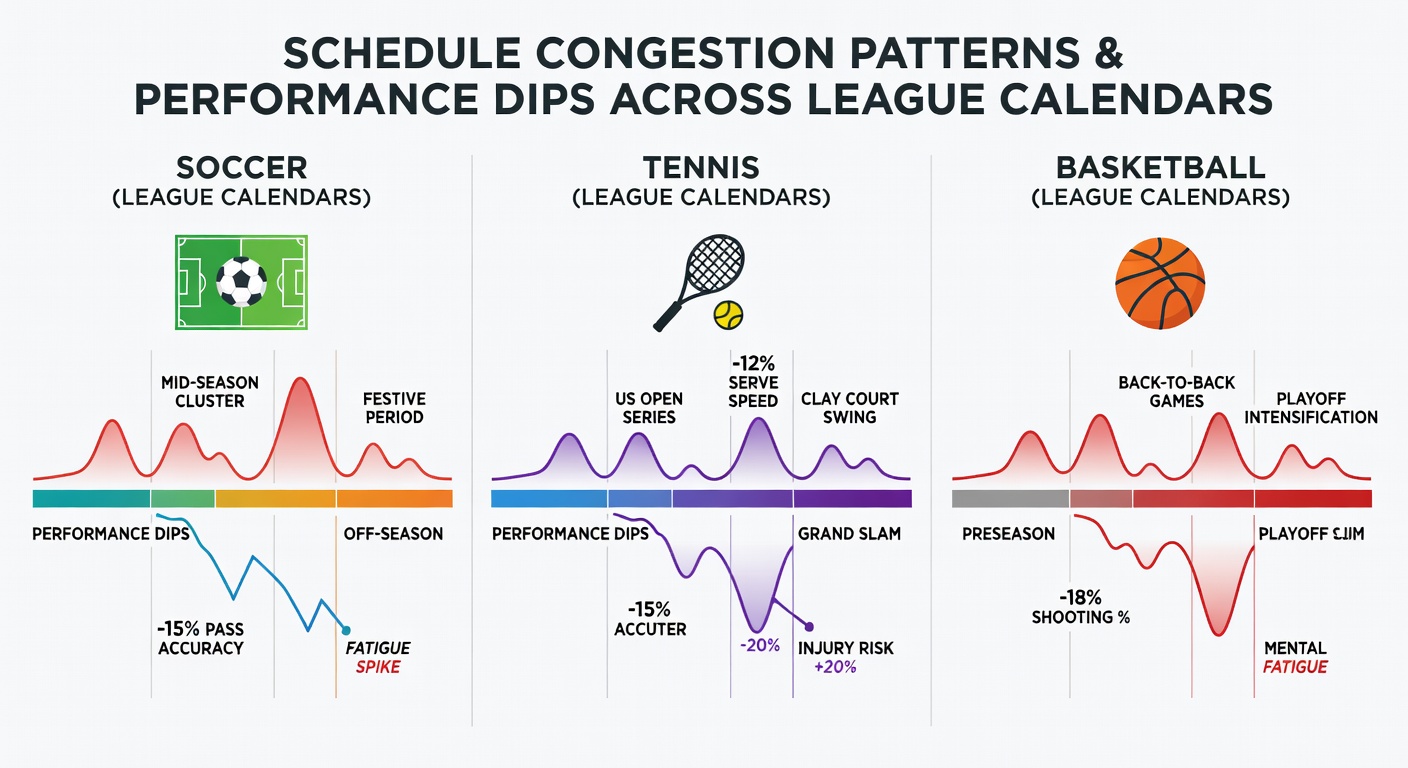
League calendars in soccer, tennis, and basketball create recurring periods of fixture congestion where teams and players face multiple high-intensity matches within short timeframes, and analysts track how these clusters correlate with measurable changes in win percentages, injury rates, and point differentials. Data from major competitions shows that squads navigating three or more games in seven days often record lower output in metrics such as distance covered per minute in soccer or serve percentages in tennis, while basketball teams encounter elevated turnover rates after consecutive road contests.
Soccer Calendar Pressures and Match Outcome Trends
European domestic leagues and international tournaments pack fixtures into winter and spring blocks, with December and May windows producing the densest schedules because cup ties, league rounds, and continental commitments overlap. Observers note that clubs contesting matches every two to three days during these stretches post reduced goal conversion rates in the second halves of games, and statistical reviews from the 2025-2026 season indicate a 4 to 7 percent drop in points per game for sides playing four fixtures across fourteen days compared with teams averaging one match per week. In May 2026 several leagues will conclude their campaigns amid a compressed run of remaining fixtures, and historical patterns reveal that teams with thinner squads experience steeper declines in clean sheet percentages during these final clusters.
Tennis Tournament Density and Player Efficiency Metrics
The ATP and WTA calendars feature mandatory events alongside optional ones, so players who advance deep in consecutive weeks accumulate high match volumes while traveling across continents. Performance databases compiled by tournament organizers indicate that competitors logging more than eight matches in a three-week span record first-serve win percentages that fall by roughly three points on average, and those who reach multiple finals within fourteen days show increased rates of retirement or walkover in later rounds. Surface transitions add another layer because players moving from clay to grass courts within short intervals must adjust movement patterns quickly, and records kept by the International Tennis Federation document higher unforced error counts during the opening matches of the new surface block.
Basketball Schedule Clusters and Statistical Output Changes
NBA and EuroLeague teams navigate back-to-back games and three-in-four-night sequences during the regular season, particularly in January through March and again near the play-in tournament cutoff. League tracking data reveals that teams playing on the second night of a back-to-back post field goal percentages approximately two points lower than season averages, while defensive rebounding efficiency also slips when travel distance exceeds 1,500 miles between consecutive games. College basketball conferences in the United States similarly compress conference play into February and March, and reports from the NCAA show elevated foul trouble rates for teams that play four games in ten days during tournament qualification windows.
Recovery protocols influence how quickly squads rebound from these clusters, yet even with sports science support the cumulative load still registers in subsequent results. Studies conducted by the Australian Institute of Sport on elite athletes across multiple codes found that heart rate variability markers remain suppressed for up to seventy-two hours after a congested block, which aligns with observed reductions in high-speed running output in soccer and decreased second-serve effectiveness in tennis.
Cross-Sport Comparisons and Shared Calendar Features
Although the three sports differ in match duration and physical demands, common calendar features produce parallel effects: travel across time zones, limited rest days, and the requirement to maintain performance across surfaces or court types. Researchers at the University of Michigan examined load management strategies in basketball and drew parallels to soccer squad rotation patterns, noting that both sports see measurable upticks in soft-tissue injury incidence when rest intervals drop below forty-eight hours between contests. Tennis stands apart because individual athletes bear the full load without substitution options, yet aggregate data still shows performance convergence across the three disciplines once weekly match counts exceed three.
League organizers have adjusted calendars in recent cycles by inserting additional rest windows in some competitions, but overlapping international windows and broadcast-driven scheduling continue to create dense periods. Figures released by FIFA technical reports and ATP performance analytics both highlight that May and June blocks remain among the most congested for players involved in multiple competitions, and those data sets will be updated again after the 2026 season concludes.
Conclusion
Schedule congestion patterns across soccer, tennis, and basketball produce consistent associations with performance metrics such as reduced efficiency ratings, elevated error counts, and higher injury incidence when rest intervals shorten. Data collected through league tracking systems and independent sports science studies continues to map these relationships, providing objective benchmarks that teams and tournament planners reference when constructing future calendars.