Depth Charts Driving Prop Bet Outcomes Across Football and Basketball Seasons
Zoe Sullivan · Jun 2, 2026
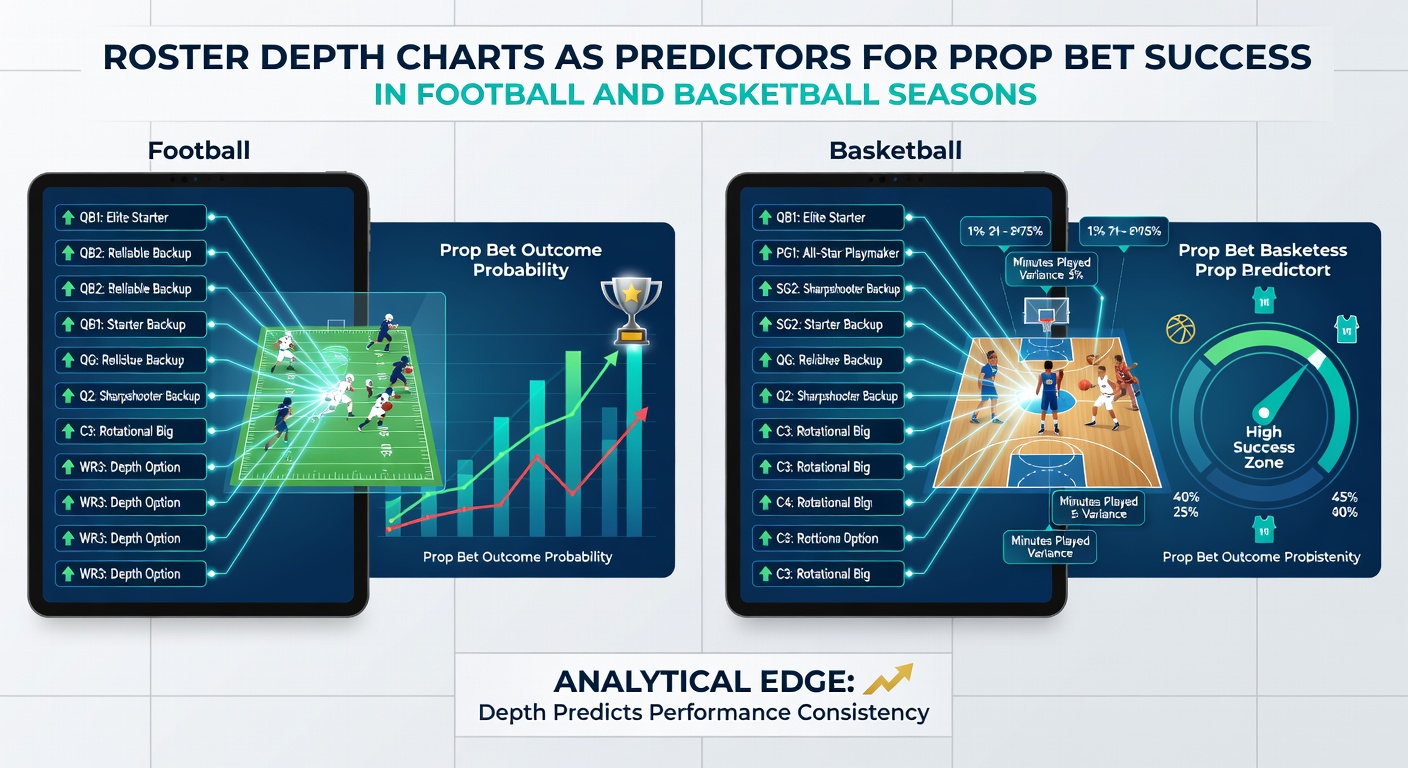
Depth Charts Driving Prop Bet Outcomes Across Football and Basketball Seasons
Roster depth charts serve as structured representations of team lineups that analysts examine when evaluating prop bets in football and basketball, and researchers track how these charts correlate with individual player performance metrics throughout entire seasons. Data from multiple leagues indicate that teams maintaining consistent depth at key positions often produce more predictable outcomes for props involving yards, points, or rebounds, while thinner benches create volatility that affects betting lines in measurable ways. Observers note that in football, depth at running back and wide receiver positions frequently influences over-under props on rushing attempts or receptions because backups step into expanded roles during injury stretches or blowout games. Studies compiled by university researchers highlight cases where depth charts updated after training camp reveal shifts in snap counts that precede changes in player prop averages across a 17-game schedule.Football Applications and Seasonal Patterns
Football depth charts list starters alongside reserves at each position, and analysts compare these listings against historical usage rates to forecast props such as passing completions or defensive tackles. When a backup quarterback appears higher on the chart due to starter rest protocols, prop markets for rushing yards by that signal-caller adjust accordingly, and records from recent campaigns show elevated success rates for bets placed after such adjustments become public.
Teams that rotate running backs according to published depth hierarchies tend to distribute carries more evenly, which spreads risk across multiple prop options rather than concentrating value on one primary back. June 2026 off-season reports from league sources reveal several clubs revising depth charts ahead of training camps, creating early signals for bettors tracking training camp participation numbers.
Basketball Depth and Prop Correlations
Basketball rosters function differently because five-player units rotate more frequently, yet depth charts still outline expected minutes for starters and bench contributors. Prop bets on points, assists, or rebounds gain clarity when teams publish rotation plans that indicate which reserves will receive increased playing time during load-management periods or back-to-back schedules.
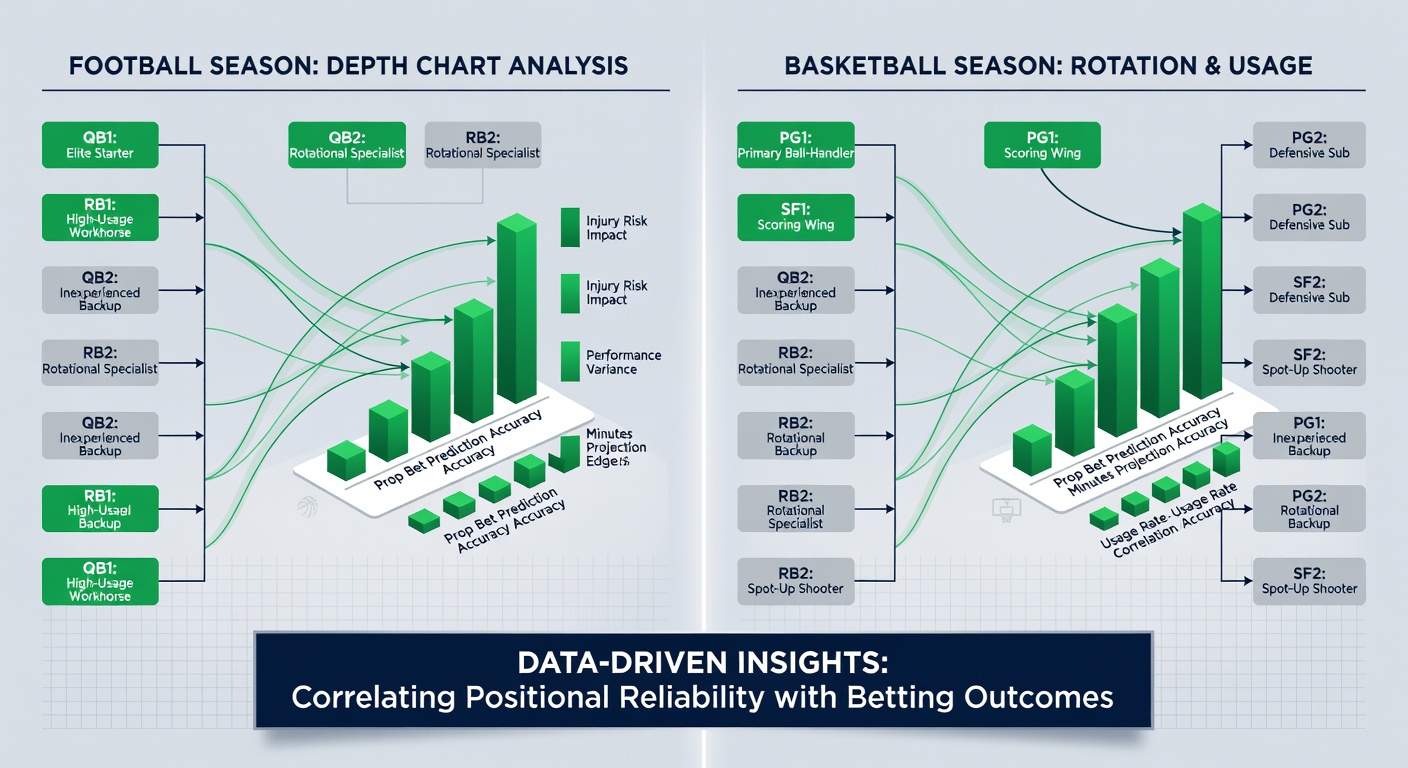
Research from academic institutions demonstrates that squads with strong second-unit depth produce steadier individual stat lines for role players, reducing variance in over-under props on three-pointers or steals. When a starting center moves down the depth chart for rest, the next player on the list often sees elevated rebounding props that align with prior season data from similar situations.
Data Integration and Predictive Models
Statisticians combine depth chart information with advanced metrics such as player efficiency ratings and usage percentages to build models that project prop success probabilities. These models incorporate injury reports and coaching tendencies, allowing for adjustments that reflect real-time roster changes rather than static preseason projections.
Industry organizations including the American Gaming Association publish aggregated data showing correlations between depth stability and prop betting volume across major sportsbooks. One study released through university channels examined three consecutive seasons and found that football teams with fewer than two changes to their top-10 depth chart entries produced prop outcomes within expected ranges more often than squads with frequent lineup shifts.
What's interesting is how basketball depth charts updated mid-season after trade deadlines alter prop landscapes in ways that reward timely analysis. Teams acquiring depth at wing positions frequently see improved three-point prop accuracy for multiple players sharing the court, and records confirm these patterns repeat across conferences.
Seasonal Timing and June 2026 Context
June 2026 marks the period when both football and basketball organizations release preliminary depth charts ahead of summer workouts and fall training camps. These early releases provide baseline data that analysts cross-reference with free-agent signings and draft selections to refine prop projections for the upcoming campaigns.
Records maintained by league statisticians show that depth charts undergo multiple revisions between June and September, each revision carrying implications for prop markets that open during preseason. Teams demonstrating clear hierarchies at skill positions tend to generate more reliable prop data streams from the first regular-season week onward.
Conclusion
Roster depth charts function as foundational tools that connect team personnel decisions with measurable prop bet outcomes in football and basketball. When analysts integrate these charts with performance data, patterns emerge that support more accurate evaluations across full seasons. Continued tracking of depth movements through June 2026 and beyond supplies ongoing material for refining these predictive approaches in both sports.