Calendar Crunch Ripples: Fixture Overloads Reshaping Timing Windows in Soccer, Tennis, and Basketball Markets
Jordan Fischer · Jun 20, 2026

Calendar Crunch Ripples: Fixture Overloads Reshaping Timing Windows in Soccer, Tennis, and Basketball Markets
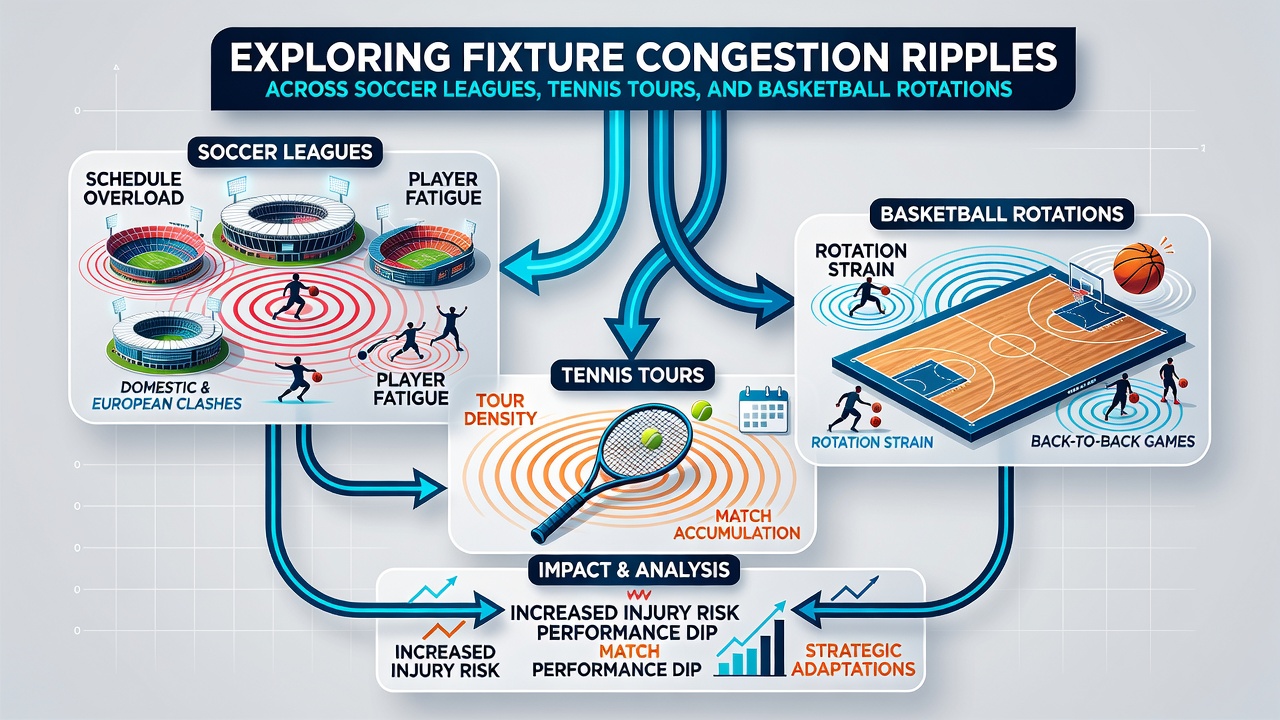
Fixture congestion creates measurable ripples through performance data and betting markets as teams and players navigate packed calendars, and observers note how these patterns open specific timing windows for market participants who track schedule density closely. Soccer leagues face repeated midweek commitments alongside weekend fixtures while tennis tours stretch across continents with minimal recovery gaps and basketball rotations contend with back-to-back games plus load management protocols.
Soccer Leagues Face Overlapping Demands
European domestic competitions pile additional cup ties and continental matches onto already dense timetables, and data from league tracking systems shows elevated fatigue markers in squads that play three games within eight days. Teams in the Premier League, La Liga, and Bundesliga often encounter such clusters during autumn and spring blocks, which leads analysts to monitor substitution rates and distance covered metrics that tend to decline after the second fixture in a short window. International breaks compound the issue when clubs release players for national team duties only to recall them for immediate domestic return, and studies compiled by sports science groups indicate recovery timelines stretch beyond the typical 72-hour mark under these conditions.
Tennis Tours Stretch Player Resources
ATP and WTA calendars pack multiple events into consecutive weeks, forcing athletes to manage travel across time zones while maintaining competitive edges, and performance records reveal drops in first-serve percentages and rally endurance during the latter stages of extended tours. Grand Slam qualifying rounds followed immediately by main-draw commitments create further strain, while those who study match logs find that players with fewer than four rest days between tournaments post lower win rates in deciding sets. Surface transitions add another layer as competitors shift from clay to grass or hard courts within short periods, and schedule databases maintained by tour organizers highlight how certain regions experience denser event clustering during spring and summer months.
Basketball Rotations Adapt to Load Pressures
NBA and EuroLeague teams incorporate deliberate rest strategies amid 82-game seasons plus playoff extensions, and rotation data indicates coaches reduce minutes for key players following back-to-back road games to preserve output in later quarters. College basketball schedules in North America also feature condensed conference play that overlaps with non-conference travel, leading researchers at athletic performance labs to track heart-rate variability as an early indicator of accumulated stress. June 2026 brings additional considerations as summer league preparations and international commitments begin to overlap with off-season recovery windows for professional rosters.
Market timing benefits from attention to these congestion patterns because odds compilers adjust lines when historical data shows performance variance tied to fixture density. Bettors who follow advanced metrics often position entries ahead of known heavy periods while others wait for in-play adjustments once early signs of fatigue appear on the court or pitch.
Cross-Sport Patterns Inform Broader Timing Strategies
Analysts who compare datasets across disciplines observe that soccer teams with congested midweeks show increased draw frequency in subsequent league matches while tennis players exhibit higher unforced error counts after transcontinental travel, and basketball lineups post reduced three-point accuracy following multiple short-turnaround games. These trends appear consistently in aggregated statistics released by league offices and tour statisticians, allowing market observers to anticipate where value may surface before public perception fully incorporates the schedule impact. Academic papers from sports management departments at universities in Australia and Canada further document how travel distance combined with game frequency correlates with measurable output declines across athlete cohorts.
Regulatory bodies such as the FIFA calendar committee publish updated international match windows that clubs must integrate into planning, and these releases often trigger early line movements in related betting markets. Industry reports from organizations like the Sports Market Research Association track how schedule announcements influence wagering volumes in advance of congested periods, giving participants concrete reference points for positioning.
Conclusion
Fixture congestion ripples continue to influence performance baselines and market timing across soccer leagues, tennis tours, and basketball rotations as participants refine approaches based on accumulating schedule data. Observers who integrate travel logs, recovery metrics, and historical outcome patterns gain clearer sightlines into periods when adjustments become most pronounced, and the interplay between these factors remains a steady focus for those monitoring timing opportunities in evolving calendars.