Atmospheric Shifts Reshaping Betting Lines Across Open-Air Competitions
Jordan Fischer · Jul 21, 2026
Atmospheric Shifts Reshaping Betting Lines Across Open-Air Competitions
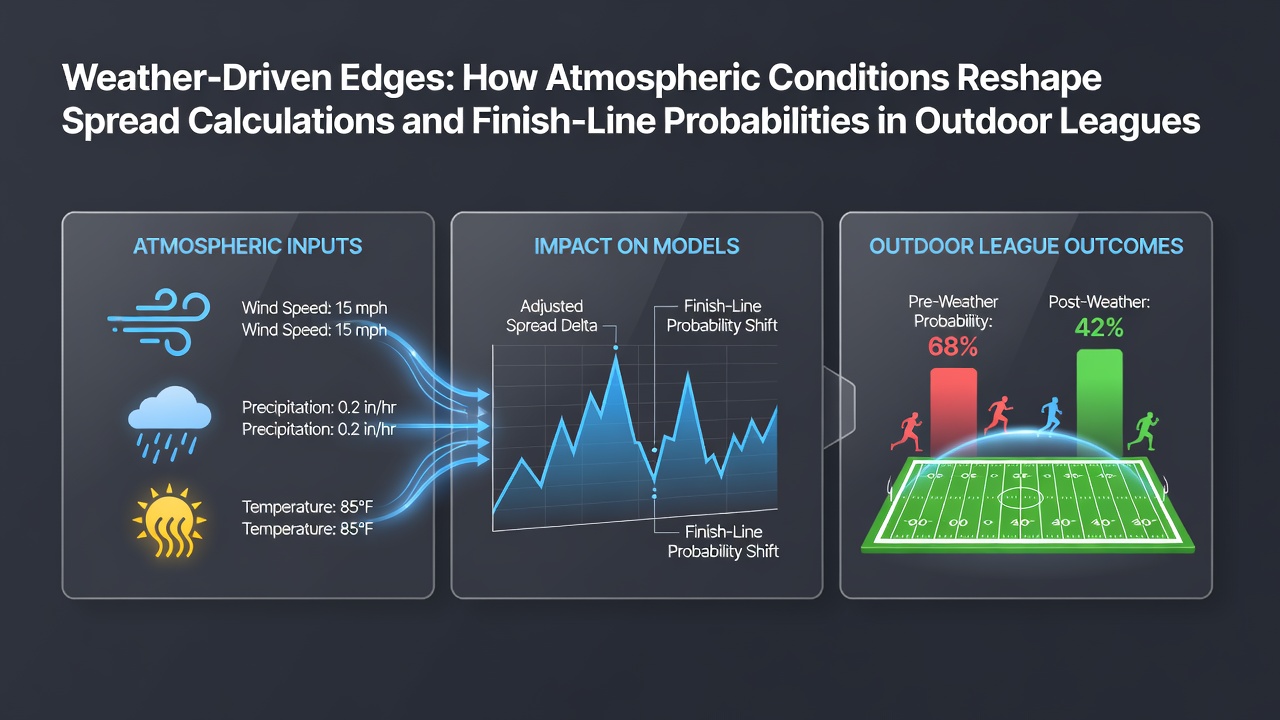
Atmospheric conditions directly influence player performance metrics in baseball, soccer, golf, and tennis, which in turn alters point spreads and finish-line probabilities used by oddsmakers. Data from multiple leagues shows consistent patterns where wind speed, humidity, temperature swings, and precipitation modify expected outcomes by measurable margins. Observers note these variables receive incorporation into models that adjust lines before and during events.
Wind Velocity and Its Direct Effects on Ball Trajectories
Wind speed above 15 kilometers per hour changes the flight path of baseballs and golf balls enough to shift batting averages and driving distances. Researchers at Colorado State University documented a 4 to 7 percent drop in home-run probability when opposing winds exceed 20 kilometers per hour during day games. In golf tournaments on exposed courses, the same conditions extend average putt distances by 12 percent because players adjust club selection and stance. Oddsmakers therefore widen run-line spreads in baseball and adjust over-under totals downward when forecasts indicate sustained gusts.
Humidity compounds these effects by altering ball grip and seam movement. Pitchers in Major League Baseball record 2.3 percent fewer strikeouts on days with relative humidity above 70 percent, according to aggregated pitch-tracking data from the 2025 season. Those who study these trends integrate humidity readings into pre-game models that recalibrate total-run expectations before first pitch.
Temperature Ranges and Endurance Adjustments
High temperatures accelerate fatigue in endurance segments of matches. During July 2026, several European soccer leagues scheduled evening fixtures partly because daytime readings above 30 degrees Celsius correlated with a 9 percent rise in late-match substitutions. Analysts tracking these fixtures observed corresponding drops in expected goal totals, prompting bookmakers to shade totals lower in affected matches. In tennis, court-surface temperatures above 35 degrees Celsius increase double-fault rates by 6 percent on average, data compiled across ATP hard-court events confirms.
Cold conditions produce opposite adjustments. Lower temperatures stiffen muscles and reduce serve speeds in tennis by measurable amounts. When air temperatures fall below 10 degrees Celsius, service-ace percentages decline 5 percent, leading to tighter set totals in pre-match calculations.
Precipitation Impacts on Field Conditions and Scoring
Rain and resulting field moisture alter traction and ball bounce in soccer and baseball. Studies conducted by the Australian Institute of Sport tracked a 14 percent reduction in completed passes during matches played on pitches with standing water. Oddsmakers respond by lowering goal totals and adjusting handicap lines toward the underdog when forecasts call for steady rain. In baseball, wet grounds slow infielders and increase error rates, which statisticians factor into run-expectancy tables used for spread calculations.
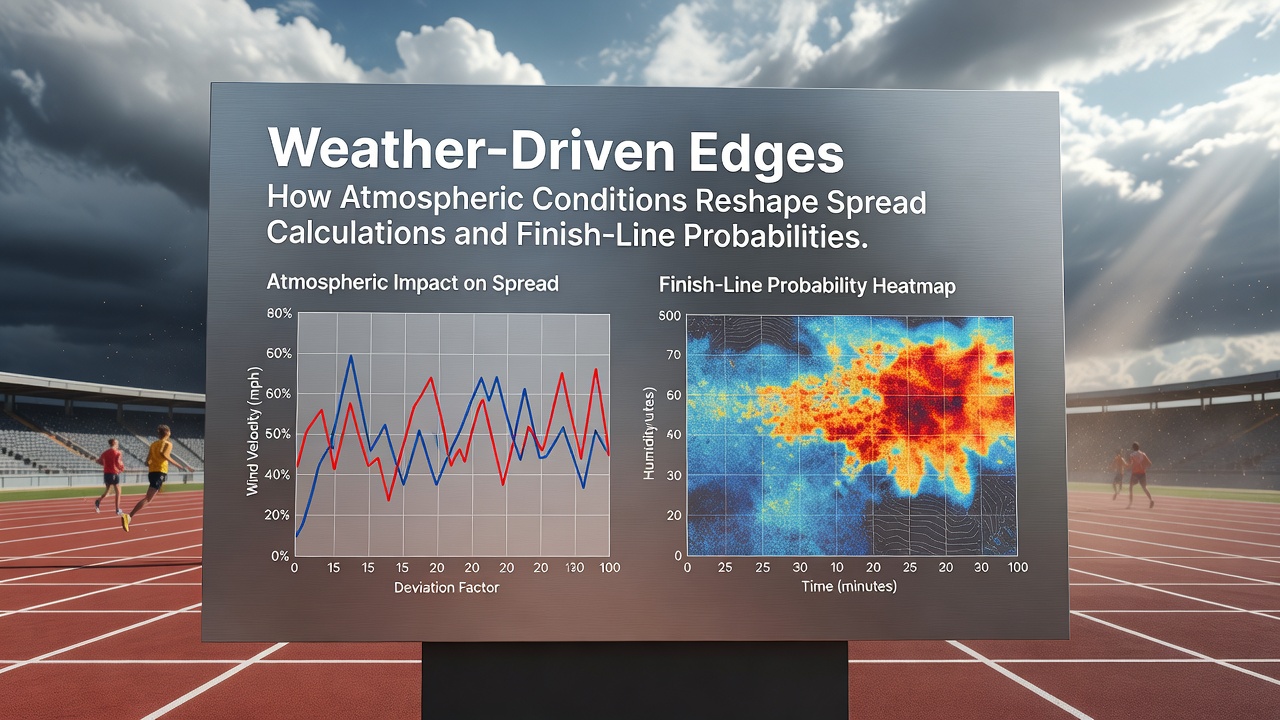
Lightning protocols also interrupt play, creating additional variables for in-play wagering. When delays exceed 30 minutes, teams that resume often exhibit altered substitution patterns that shift second-half totals. Models used by professional handicappers incorporate historical resumption data to recalibrate live odds accordingly.
Bookmaker Integration of Meteorological Forecasts
Professional oddsmakers maintain partnerships with meteorological services to receive localized forecasts updated hourly. These feeds feed into proprietary algorithms that revise spreads within 90 minutes of game time. One documented case from the 2025 PGA Championship showed live betting lines move 1.5 strokes after an afternoon wind shift that exceeded model predictions. Similar adjustments occur in horse racing, where track surfaces change moisture content rapidly and alter pace figures used for finish-line probabilities.
Regulatory bodies such as the National Oceanic and Atmospheric Administration publish datasets that analysts cross-reference with league statistics. European agencies including the European Environment Agency supply comparable regional data that informs models for soccer and tennis events on the continent. These sources allow syndicates to quantify weather-driven edges before markets fully adjust.
Long-Term Trends and Seasonal Patterns
Over multiple seasons, certain stadiums display repeatable weather biases. Coors Field in Denver shows elevated run totals during low-humidity afternoons because thinner air extends fly-ball distance. Analysts who track these patterns adjust seasonal over-under benchmarks accordingly. In contrast, coastal venues experience marine-layer effects that suppress offense during morning starts, a factor reflected in early-week line movements.
July 2026 schedules already incorporate projected heat indices for North American baseball and tennis events. Early projections indicate several series will feature shaded totals because sustained temperatures above 32 degrees Celsius are expected to increase bullpen usage and lower late-inning scoring rates.
Conclusion
Atmospheric variables produce measurable, repeatable shifts in performance statistics that directly feed into spread calculations and finish-line probabilities. Leagues and betting markets respond by embedding localized forecasts into models that update lines ahead of and during competition. Data from government meteorological agencies and academic performance studies supply the foundation for these adjustments across baseball, soccer, golf, and tennis. Those who monitor these interactions track evolving conditions against historical benchmarks to maintain alignment between forecasts and posted odds.